Creating User Variables
Creating a New User Variable
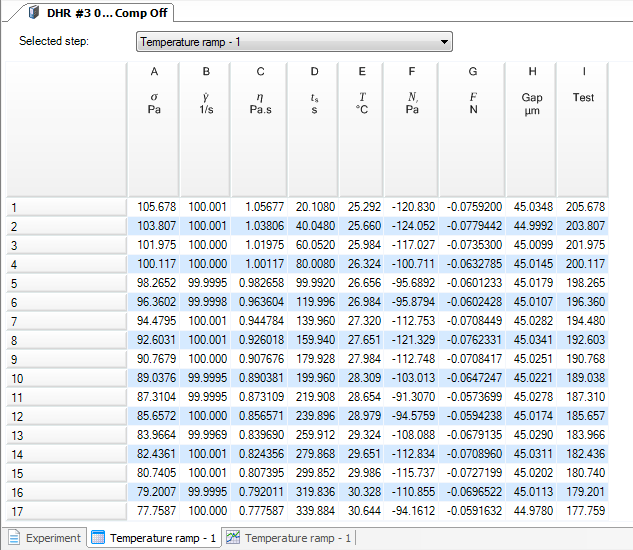
- Open the file and display the Spreadsheet view by clicking the spreadsheet tab at the bottom of the viewing pane
 .
.
- Click the User Defined
 button from the Variables toolbar of the Format tab.
- The User Variables dialog box opens. Click New.
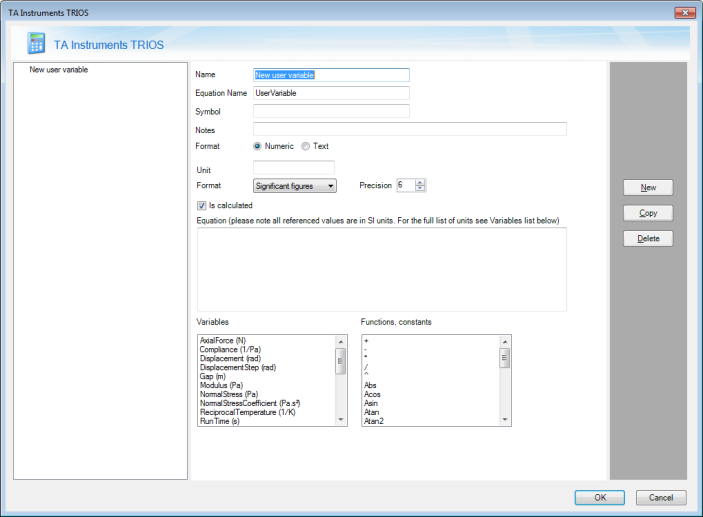
- Enter the Name of the new user variable.
- Optional: Enter the Equation Name.
- Optional: Enter the Symbol associated with the Name, which will appear with the Name on the axis of your graph and in the column of your spreadsheet) – for example the symbol t for Time.
- Optional: Add Notes, if desired.
- Select the Format of the equation: Numeric or Text (Text allows you to use both numeric and alphanumeric characters).
- Select the Format of the data that appears in the spreadsheet (most commonly used are Numeric and Significant figures).
- Optional: Enter the Unit (for example, enter min as the unit for Time).
- To create your equation, make sure the Is calculated check box is selected. De-select this option to create an empty placeholder variable in which to create your own data.
- Create your equation in the Equation text field. To use any of the variables, functions, or constants provided in the lists, double-click the items in the list to add it to the equation.
- Click OK.
Adding a New User Variable to the Spreadsheet
Once the variable has been created, you can apply it to your graph as follows:
- Click Select
 from the Variables toolbar of the Format tab (Spreadsheet view).
- The Spreadsheet Columns dialog box displays.
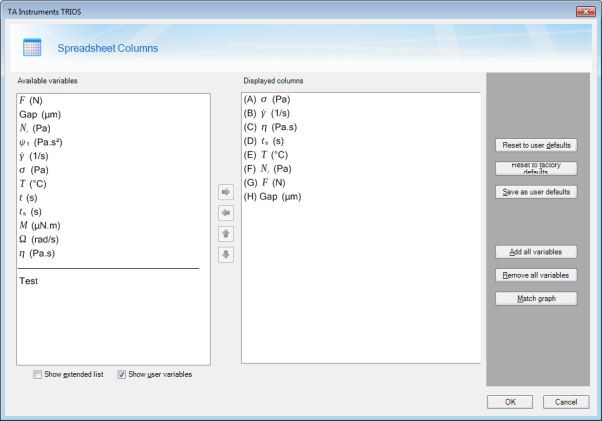
- Select the Show user variables checkbox. The new user variable displays at the bottom of the Available variables list.
- Add the new user variable to the spreadsheet columns by clicking the right arrow. The variable will move to the bottom of the Displayed columns list. If desired, reorder the columns by selecting a variable and using the up and down arrows to change its position in the list, or remove variables from the list by using the left arrow.
- Click OK.
Adding a New User Variable to the Graph
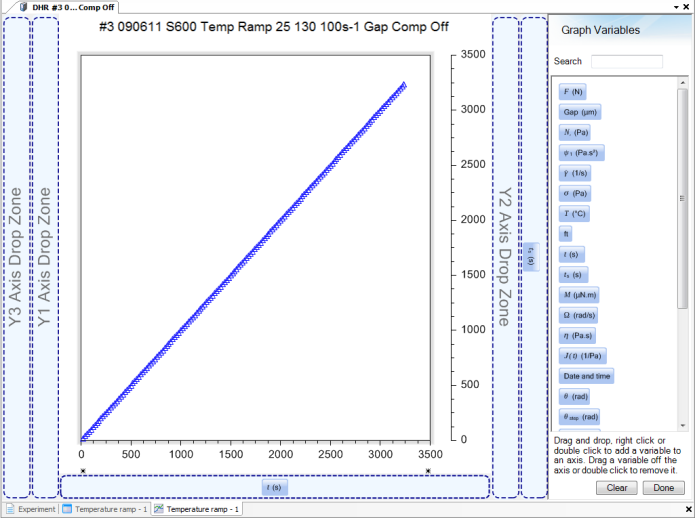
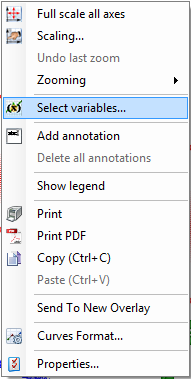
- Right-click the graph and click Select variables.
- The Graph Variables pane opens. Drag and drop the variables from the list into the graph "drop zones," which are the axes outlined in blue. The graph will populate as each axis is assigned a variable.